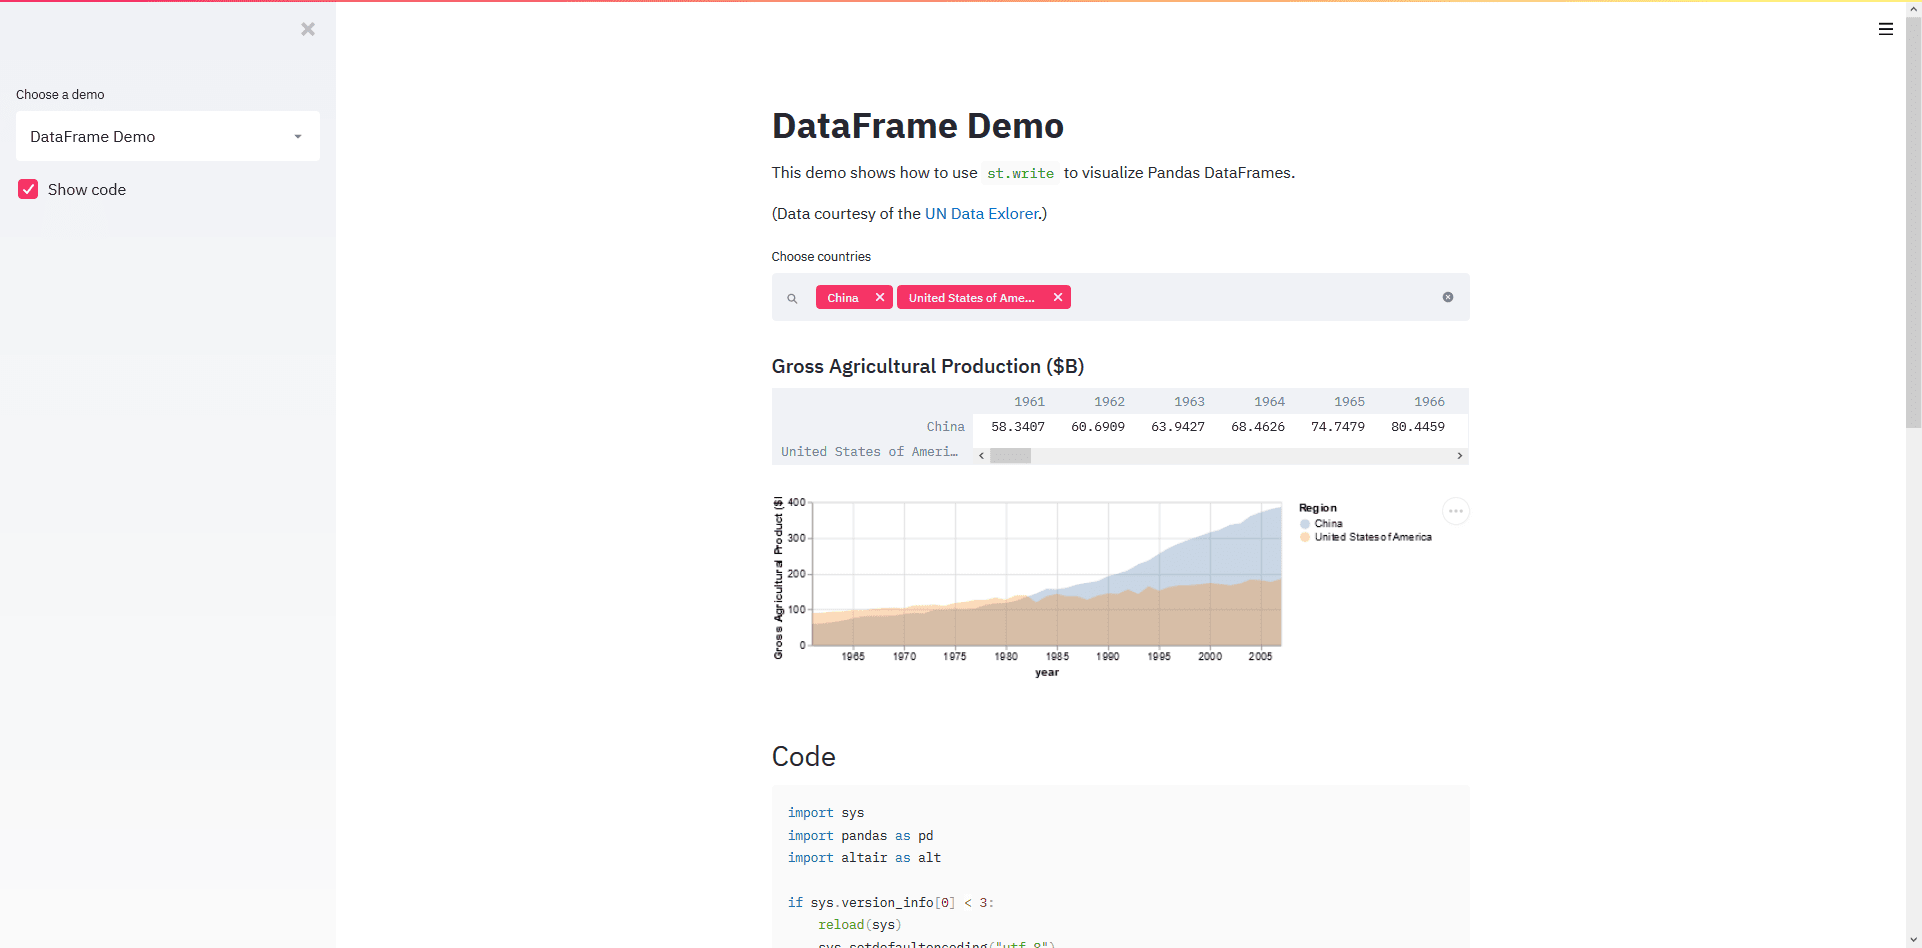
Showcasing the findings of your data science/machine learning experiment can be difficult. While in the past, a PowerPoint presentation or a LaTeX file used to be enough for showcasing your project, with today's popularity of websites, it is a good idea to know how to create a website for your project.
This is where Streamlit comes in. Streamlit is an open-source Python framework that allows you to create beautiful interactive websites for Machine Learning and Data Science projects without needing to have any web development skills.
Streamlit achieves this by allowing us to create a website by only adding a few Streamlit function calls to existing python projects/experiments.
After adding the function calls, Streamlit will display all the selected items, watch for any changes inside the script, and update the website accordingly.
At the moment, Streamlit supports displaying text, data, code, lots of interactive widgets, and many charting libraries including Matplotlib – for basic plotting – and Vega-Lite, deck.gl and Plotly for interactive graphs.
In this article, I want to show you the basics of how to use Streamlit to create beautiful python dashboards.
Installation
Streamlit can be installed using PIP:
pip install streamlit
After installing Streamlit, you can test if everything is working by running the hello world app:
streamlit hello
This will open a website on localhost:8501, where you can see a few Streamlit examples.
Getting started
Now that we are sure that everything works correctly, we can start experimenting with Streamlit.
First, we need to import Streamlit:
import streamlit as st
You can run the file by writing:
streamlit run first_app.py
This will open a new browser tab showing your current script. This browser window will automatically update after every change.
Displaying text
Streamlit has multiple methods for adding text, including st.text, st.markdown, and st.title.
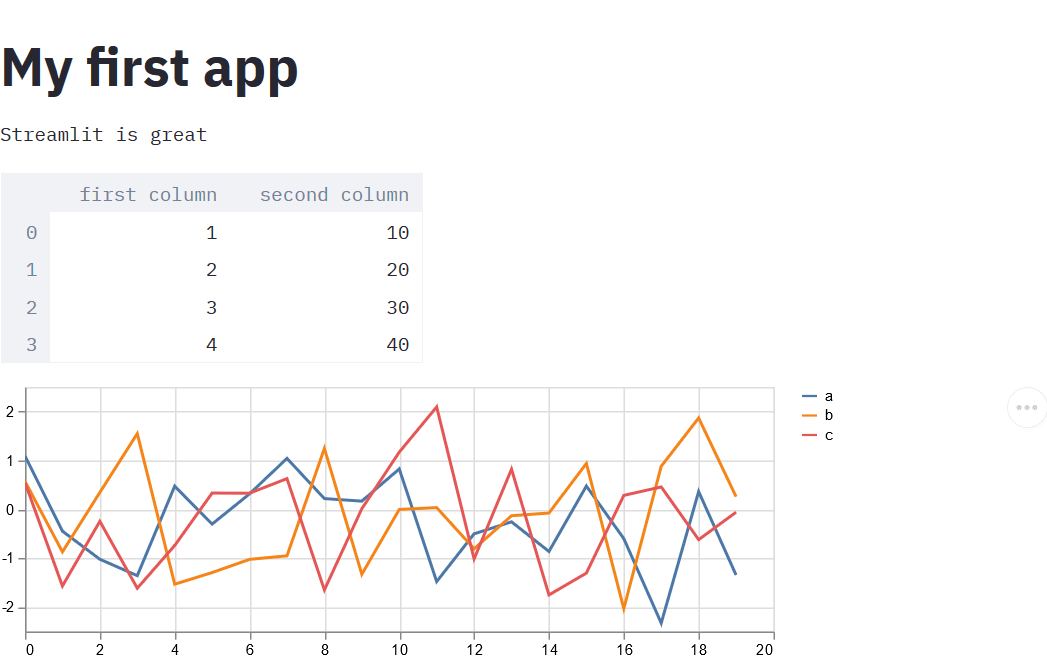
# Add a title
st.title('My first app')
# Add some text
st.text('Streamlit is great')
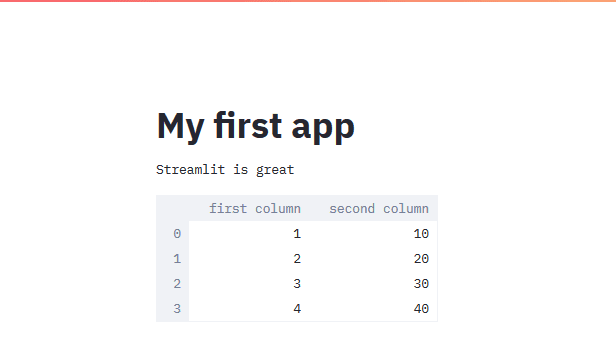
That's it. Your application now displays a title and some text.

Display a pandas dataframe
In Streamlit, a Pandas DataFrame can be displayed using the st.dataframe method.
import pandas as pd

st.dataframe(pd.DataFrame({
    'first column': [1, 2, 3, 4],
    'second column': [10, 20, 30, 40]
}))
In addition to the .dataframe method, Streamlit offers us the .write method, which automatically detects what datatype is passed and displays the data accordingly.
st.write(pandas.DataFrame({
    'first column': [1, 2, 3, 4],
    'second column': [10, 20, 30, 40]
}))
Plot a line chart
Streamlit supports several popular data visualization libraries, including Matplotlib, Vega Lite, deck.gl, Plotly, and their own simple library, which we will use to create some simple graphs.
To create a line chart with some random data, the following code can be used:
import numpy as np

chart_data = pd.DataFrame(
    np.random.randn(20, 3),
    columns=['a', 'b', 'c'])

st.line_chart(chart_data)
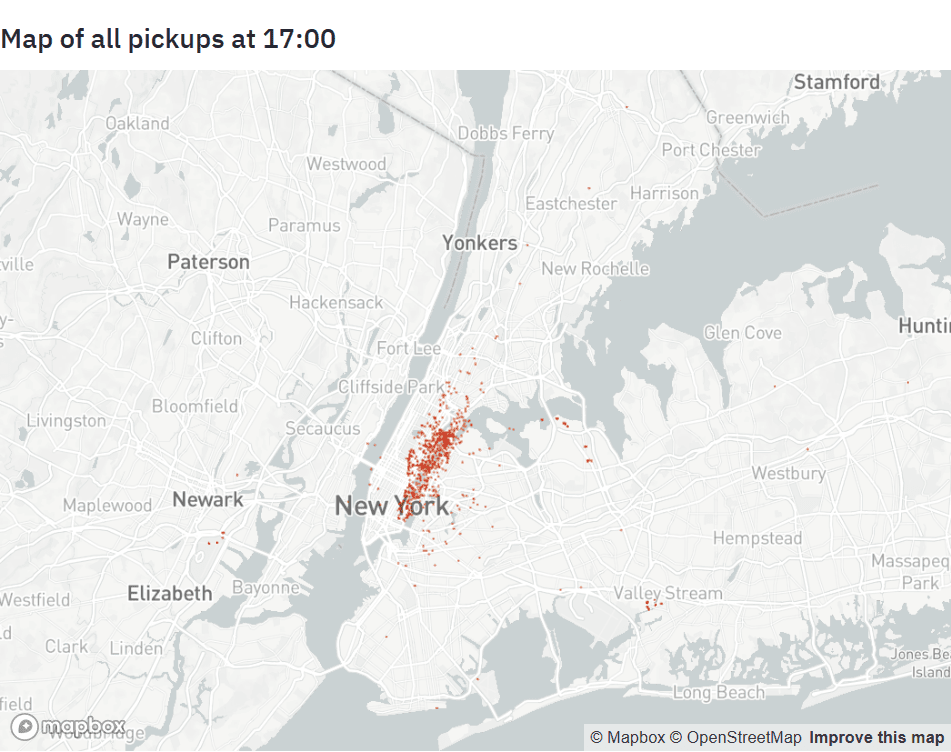
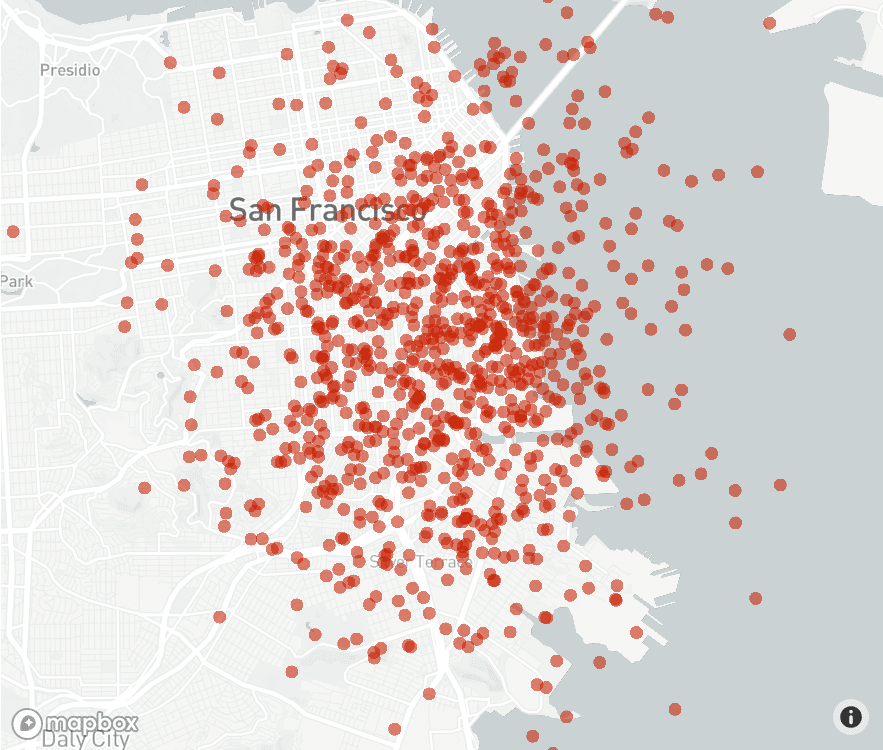
Plot a map
With Streamlit, it is super easy to create a map with some data points on it using st.map().
map_data = pd.DataFrame(
    np.random.randn(1000, 2) / [50, 50] + [37.76, -122.4],
    columns=['lat', 'lon'])

st.map(map_data)
Use Widgets
With widgets, Streamlit allows you to create beautiful interactive dashboards. Streamlit provides buttons, checkboxes, sliders, text input, date inputs, etc. For more information about all the available widgets, check out the API reference.
Use checkboxes to show/hide data
One of the widgets supported by Streamlit is the checkbox which can be used to, for example, show or hide items.
if st.checkbox('Show dataframe'):
    st.dataframe(pd.DataFrame({
        'first column': [1, 2, 3, 4],
        'second column': [10, 20, 30, 40]
    }))

    chart_data = pd.DataFrame(
        np.random.randn(20, 3),
        columns=['a', 'b', 'c'])

    st.line_chart(chart_data)

    map_data = pd.DataFrame(
        np.random.randn(1000, 2) / [50, 50] + [37.76, -122.4],
        columns=['lat', 'lon'])

    st.map(map_data)
Filter a data-frame using a selectbox
Selectboxes can be used to select one of multiple options from a list. This is super useful for filtering your data. Using it, we can, for example, filter through the columns of a Pandas data-frame.
df = pd.DataFrame(
    np.random.randn(20, 3),
    columns=['a', 'b', 'c'])

column = st.selectbox(
    'What column to you want to display',
     df.columns)

st.line_chart(df[column])
You can also select multiple items at once using st.multiselect instead of st.selectbox.
df = pd.DataFrame(
    np.random.randn(20, 3),
    columns=['a', 'b', 'c'])

columns = st.multiselect(
    label='What column to you want to display', options=df.columns)

st.line_chart(df[columns])
Slider
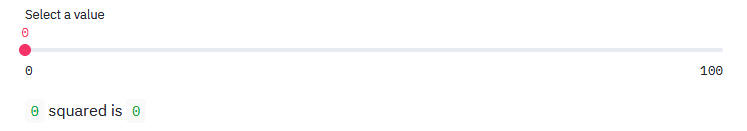
Another great widget is the slider. A slider can be used to select some specific value or multiple values. For example, the following code can be used to create a simple slider where you can select between 0-100.
x = st.slider('Select a value')
st.write(x, 'squared is', x * x)
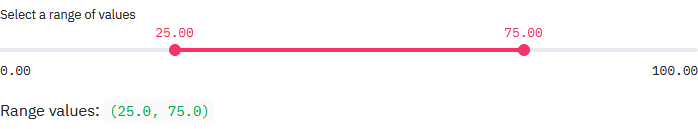
If you don't want to select one but multiple values, you need to pass multiple default values to the values argument.
x = st.slider(
    'Select a range of values',
    0.0, 100.0, (25.0, 75.0))
st.write('Range values:', x)
Cache data
Caching is super important in Streamlit since it repeatedly runs your code from top to bottom, and you don't want it to, for example, reload the entire data on every iteration.
This is where caching comes in. Caching allows you to reuse the already loaded variable instead of reloading/recomputing it. You can cache data by using the st.cache decorator.
@st.cache
def fetch_and_clean_data():
    df = pd.read_csv('<some csv>')
    # do some cleaning
    return df
For more information about caching and other useful features, take a look at the Streamlit documentation.
Layout
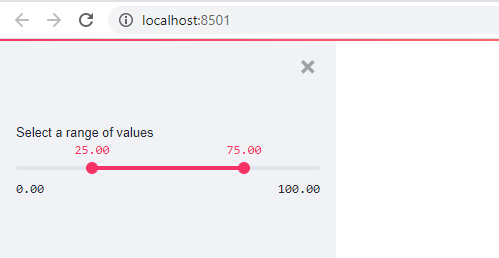
Streamlit also allows you to organize your widgets. For example, Streamlit offers a left panel sidebar. To move widgets to the sidebar, add .sidebar before the widget.
import streamlit as st

# Add a slider to the sidebar:
add_slider = st.sidebar.slider(
    'Select a range of values',
    0.0, 100.0, (25.0, 75.0)
)
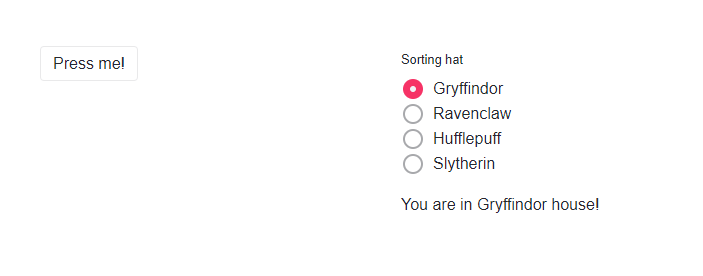
Beyond the sidebar, Streamlit also offers other ways of controlling an app's layout. st.beta_columns lets you place widgets side-by-side.
import streamlit as st

left_column, right_column = st.beta_columns(2)
# You can use a column just like st.sidebar:
left_column.button('Press me!')

# Or even better, call Streamlit functions inside a "with" block:
with right_column:
    chosen = st.radio(
        'Sorting hat',
        ("Gryffindor", "Ravenclaw", "Hufflepuff", "Slytherin"))
    st.write(f"You are in {chosen} house!")
Themes
With version 0.79.0, Streamlit is introducing support for custom themes. To create a custom theme, go to Menu → Settings → Edit Active Theme.
Once you're happy with your theme, you can save it by setting config options in the [theme] config section.
Themes can also be defined in the config file ./.streamlit/config.toml
[theme]

# Primary accent for interactive elements
primaryColor = '#7792E3'

# Background color for the main content area
backgroundColor = '#273346'

# Background color for sidebar and most interactive widgets
secondaryBackgroundColor = '#B9F1C0'

# Color used for almost all text
textColor = '#FFFFFF'

# Font family for all text in the app, except code blocks
# Accepted values (serif | sans serif | monospace)
# Default: "sans serif"
font = "sans serif"
For more information, check out the blog post and documentation.
Deployment
Streamlit can be deployed to a multitude of platforms. If your code is hosted in a public Github repository, you can try out Streamlit sharing. If you're interested in deploying your application to Heroku, I have a guide showing you how.
For more deployment options and guides, check out the Streamlit Deployment Guide (wiki).
Conclusion
In this article, I went over what Streamlit is and how to use it to turn your data science projects into beautiful websites. Streamlit is really cool because it's so easy to use, and you don't need to have any web development experience to build a website.
If you are interested, I also created a Strock Price Dashboard using Streamlit. You can take a look at it on my Github.
That's all from this article. If you have any questions or want to chat with me, feel free to contact me via EMAIL or social media.