Creating animations for math explanations can be quite challenging and requires good video-editing skills. Over the last couple of days, I tried Manim, a mathematical animation engine made by 3Blue1Brown.
3Blue1Brown is an exceptional math YouTuber who tries to explain topics visually, which gives you a completely different view on the subject.
Using Manim, he creates videos like the following:
In this article, I will walk you through the basics of Manim, including:
- How to install Manim
- How to run a project with Manim
- And how to create simple projects
You can find all the code covered in this article on my Github.
Installation
For installing Manim on your system, I recommend following the Installation guide from the Manim documentation.
Creating your first Scene
Now that you have installed everything correctly, you're ready to write your first application.
from manim import *

class SquareToCircle(Scene):
    def construct(self):
        # Creating shapes
        circle = Circle()
        square = Square()

        #Showing shapes
        self.play(Create(square))
        self.play(Transform(square, circle))
        self.play(FadeOut(square))
manim square_to_circle.py SquareToCircle -p -ql
Let us break this down step-by-step:
- The import statement on top imports everything needed to use Manim. Importing everything using the
*operator is the recommended way of using Manim, as a single script often uses multiple names from the Manim namespace. - For running animations, you have to create a class that inherits from Manims
Sceneclass. - Inside the class, you need to create the
constructmethod. Theconstructmethod is essentially the main method for the class. In it, you can write all the code for the animation. - The first two lines inside the
constructmethod create a circle and squareMObject, that are then displayed using theplaymethod.Create,TransformandFadeOutare used to add the animations.
We can also modify the appearance of the objects by adding a few lines of code:
from manim import *

class SquareToCircleWithModifications(Scene):
    def construct(self):
        circle = Circle()
        square = Square()
        square.flip(RIGHT)
        square.rotate(-3 * TAU / 8)
        circle.set_fill(PINK, opacity=0.5)

        self.play(Create(square))
        self.play(Transform(square, circle))
        self.play(FadeOut(square))
Displaying text
Displaying text is also pretty straightforward.
from manim import *


class displayText(Scene):
    def construct(self):
        # Create Text objects
        first_line = Text('Create cool animations')
        second_line = Text('using Manim')
        third_line = Text('Try it out yourself.', color=RED)

        # Position second line underneath first line
        second_line.next_to(first_line, DOWN)

        # Displaying text
        self.wait(1)
        self.play(Write(first_line), Write(second_line))
        self.wait(1)
        self.play(ReplacementTransform(first_line, third_line), FadeOut(second_line))
        self.wait(2)
To display text, you need to create a Text object and pass it the text you want to write to the screen. After that, you can display the text using the play method and some animation.
Math equations
Math equations can be written in Manim using LaTeX – a typesetting system widely used in academia. One of LaTeX's big advantages is that it allows you to create good-looking math equations with an intuitive system.
I won't go over LaTeX in this article, but if you are curious, there are many great tutorials.
Instead of using a Text object for equations, you need to use a Tex object. When making an equation, you need to put a $ at the start and end of the text.
Note: If you want to use LaTeX you'll need to install a LaTex distribution like TeX Live. For more information, take a look at the 'Optional Dependencies' section of the installation guide.
text = Text('some text')
equation = Tex('$some equation$')
You can add symbols like the summation or integral symbols with a backslash.
alpha = Tex(r'$\alpha$')
Displaying some text and an equation could look like the following:
from manim import *


class displayEquations(Scene):
    def construct(self):
        # Create Tex objects
        first_line = Text('Manim also allows you')
        second_line = Text('to show beautiful math equations')
        equation = Tex(r'$d\left(p, q\right)=d\left(q, p\right)=\sqrt{(q_1-p_1)^2+(q_2-p_2)^2+...+(q_n-p_n)^2}=\sqrt{\sum_{i=1}^n\left(q_i-p_i\right)^2}$')

        # Position second line underneath first line
        second_line.next_to(first_line, DOWN)

        # Displaying text and equation
        self.play(Write(first_line), Write(second_line))
        self.wait(1)
        self.play(ReplacementTransform(first_line, equation), FadeOut(second_line))
        self.wait(3)
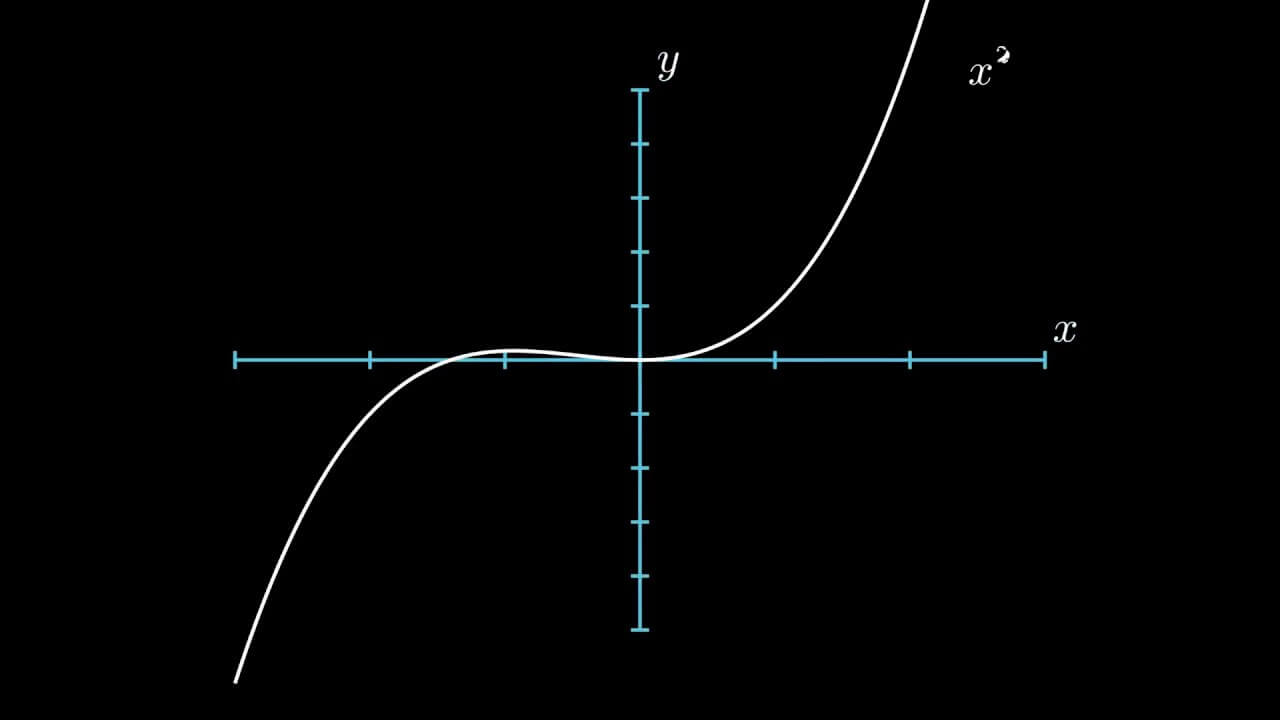
Creating graphs
Manim also allows us to create and display graphs. For this, you need to create a class that inherits from the GraphScene class.
from manim import *


class CreateGraph(Scene):
    def construct(self):
        axes = Axes(
            x_range=[-3, 3],
            y_range=[-5, 5],
            axis_config={"color": BLUE},
        )

        # Create Graph
        graph = axes.plot(lambda x: x**2, color=WHITE)
        graph_label = axes.get_graph_label(graph, label='x^{2}')

        graph2 = axes.plot(lambda x: x**3, color=WHITE)
        graph_label2 = axes.get_graph_label(graph2, label='x^{3}')

        # Display graph
        self.play(Create(axes), Create(graph), Write(graph_label))
        self.wait(1)
        self.play(Transform(graph, graph2), Transform(graph_label, graph_label2))
        self.wait(1)
As you can see, to create a graph, you need to create a method that returns a y value for every x value it gets. In the code above, I used lambda functions to specify them, but you can also use any other method. After you have created the method you need to pass it to axes.plot, which creates a mobject out of the method.
3d graphing
To create a 3d graph, you need to inherit from the ThreeDScene class.
from manim import *

class threeDGraph(ThreeDScene):
    def construct(self):
        axes = ThreeDAxes()
        circle=Circle()
        self.set_camera_orientation(phi=75 * DEGREES, theta=30 * DEGREES)
        text3d = Text("This is a 3D text")
        self.add(circle,axes)
        self.add_fixed_in_frame_mobjects(text3d)
        text3d.to_corner(UL)
        self.add(axes)
        self.wait()
Using Manim with Jupyter
Manim also ships with a %%manim IPython magic command, which allows you to use Manim inside Jupyterlab / Jupyter Notebooks.
For more information, check out the corresponding documentation.
Other great resources
Conclusion
Manim is a powerful mathematical animation engine written in Python. With it, you can create beautiful animations with only a few lines of code. I really like the process of creating animations using code because, in my opinion, it makes things way more reproducible and easy to change.
That's all from this article. If you have any questions or want to chat with me, feel free to contact me via EMAIL or social media.